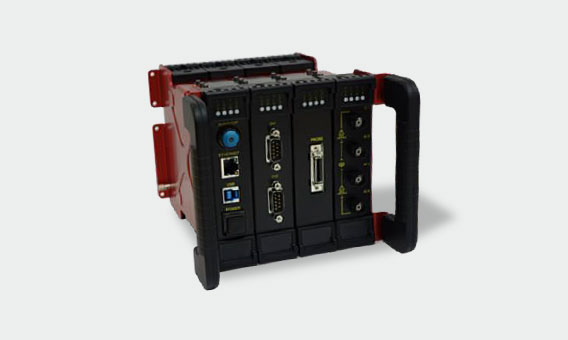
RAMScope-EXG GT170
Multi RAM data monitor (measurement) tool that enables synchronous measurement / synchronous analysis among multiple ECUs.
It is possible to cooperate with calibration tool and HILS system.
Overview of RAMScope-EXG (GT170 series)
In the field of control software development installed in ECU, time and cost for testing and verification work that guarantees performance, quality, and safety before launching new cars has increased, and further improvement in productivity is required.
RAMScope-EXG (GT170 series) is a measurement tool that supports complicated ECU control application.
Functions of RAMScope-EXG (GT170 series)
Module type multi measurement system that extracts internal variable (internal RAM value) related to ECU control in real-time and can measure CAN or analog signal synchronously.
RAMScope-EXG (GT170 series) is a perfect tool to improve efficiency of the function and characteristic verification in the real-time target of on-vehicle control software.
Authentic verify test of control process is available by measuring internal variable of on-vehicle control software processing added with measurement of input/output signals and communication data from the outside of ECU in real-time.
As development promoting support functions in the process of development, RAMScope-EXG (GT170 series) provides the environments such as the function of injecting measurement variables for test (scenario write) and the function of sending CAN simulating an external ECU (transmission of scenario).
You can also promote the coverage of software processing test and function check of unit test, joint test, or system test in development process.
RAMScope-EXG (GT170 series) supports ASAM standard communication protocol “MCD-1 XCP” and file format “MCD-2 MC(a21)” and “MDF”. It can work together with relevant tool which supports ASAM standards or HILS (Hardware-In-the-Loop-Simulation) of other companies.
It also supports overseas export law regulations, so it can be used as a global tool.
[ RAMScope-EXG GT170 operation image ]

Features of RAMScope-EXG (GT170 series)
- Synchronous measurement of measurement variables, CAN data, and analog signals of multiple microcomputers
- You can select RAM data measurement module, CAN communication measurement module or analog measurement module of microcomputer according to user system.
- Measurement and collection of measurement variables without putting loads on control application
- RAM monitor cycle: minimum 5 μs (depends on debug interface of microcomputer and number of monitor channels)
- Number of monitor channels: maximum 2,048 channels
- Coordination control of measurement start and stop can be performed by event trigger of each module
- ASAM standard: supports XCP on Ethernet
- CAN / CANFD measurement
- Supports dynamic measurement range 1 V to 100 V (maximum 1,000 V)
- Synchronous measurement of up to 10 modules (including power supply modules)
- Test support function added
[ RAMScope-EXG GT170 testsupport function image ]

RAMScopeVP (measurement application)
- Two operation modes:
- Online mode (working together with RAMScope hardware and controlling measurement and data tuning in real-time)
- Offline mode (editing measurement settings and analyzing measurement data by RAMScopeVP only)
- Various setting functions:
- Environment setting function: Each module (RAM / CAN / analog)
- Measurement condition setting function: Can be set for each module (measurement variable: symbol / parameter, CAN: message / signal)
- Setting Conditions for Data Acquisition (START/STOP)
- Restore setting condition and screen display state by using project file
- Test support setting:
- Up to 64 channels measurement variables can be read and overlaid in a single user interface
- Display function:
- Superimposed graph display of acquisition data is available. Docking window enables layout setting as you like.
- Data format:
- Exports measured data aisfter acquition in ASAM standard format
[ Superimposing measurement channel / Graph window which can be displayed by unit ]
Graphical representation of RAM (address input, symbol, A2L file registration), CAN message signal (CANdb registration) and change in analog signal.
Acquisition data can be analyzed and displayed in maximum / minimum, average value. You can use a cursor to measure cycle time of a waveform parameter.

[ Variable Watch Window for Reading / Overlay Variables ]
Any internal ECU measurement variables can be referred to and edited asynchronously with the measurement operation.
The symbol name for a memory address can be registered.
You can register 64 symbol names in a tab. Up to 16 tabs are available.
You can set conversion rules for converting to physical units for each channel. Therefore you can refer the symbol name by using physical image.
Convenient calibration, up to 64 parameters placed in a memory can be changed in a single interface.

[ Docking window with flexible layout ]
Window creation starts in a floating state independent of the main window.
The floating state window can be arranged freely outside the frame of the main window.
It can be combined and tabbed for the main window or between windows.

[ Event/logging trigger setting ]
The following 8 events can be set for the effective measurement target.
Marking display and acquisition control are also available for event established.
Event conditions…=, ≠, <, >, within, without, rise edge, fall edge.

[ Improved visibility such as multigraph, bar graph, and pie graph ]

[ Bar graph display ]
Bar display: Up to 8 channels can be displayed. You can set formats such as axis resolution etc.

[ Pie graph display ]
Pie graph display: Up to 8 screens can be registered. You can set formats such as axis resolution etc.

[ Line graph display ]
Line graph display: Up to 4 screens can be registered. You can set formats such as axis resolution etc.

[ Testing ECU support function (Scenario write) ]
Function that supports both evaluate and test execution in ECU development.
Prepares test patterns to be given to ECU internal variables as a test scenario.
Injects the test patterns in the test scenario into internal variables sequentially and analyzes changes in ECU behavior.
[ Testing CAN communication support function ]
Function that simulates the nodes under development other than evaluation target ECU and sends it easily.
Prepares signal patterns to be sent as a test scenario.
Sends the test patterns in the test scenario to signals sequentially.
Analyzes ECU behavior at this time.