Non-Intrusive System Visualization
The real-time RAM monitoring and visualization solution
for Arm® Cortex®-A/R/M and RISC-V®.
What is EVRICA?
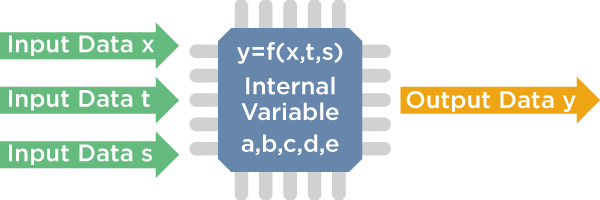
A high-speed data monitoring tool for real-time visualization of variables in RAM(random-access memory) during program execution.

EVRICA also visualizes changes in the values of variables and parameters in the program in real-time and tracing memory data clarifies the process of arithmetic operations during system execution.
Context: why you need EVRICA?
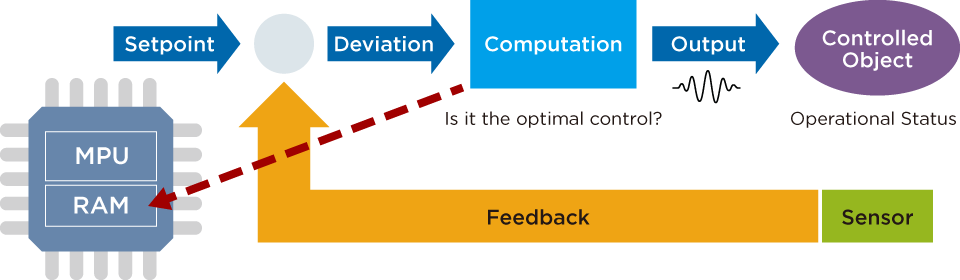
The Backbone of Embedded Systems: Visualizing Control in Motion
Feedback control is the heart of embedded system development. For precise verification, it is essential to monitor calculation results at every control cycle without interrupting critical processes like actuator or communication control. You need to see the system evolve, continuously and in real-time.
EVRICA makes this possible: EVRICA delivers high-speed sampling and live visualization for "unstoppable" systems with no code modification required, providing insights into internal behavior with microsecond precision.
Voices from the Frontline: Common Challenges

- Zero Downtime: Monitoring without stopping the system.
- Non-Intrusive: No impact on system performance or behavior.
- Intra-Cycle Speed: Monitoring at speeds within the control cycle.
- Plug & Play Simplicity: Set up and visualize as easily as possible.
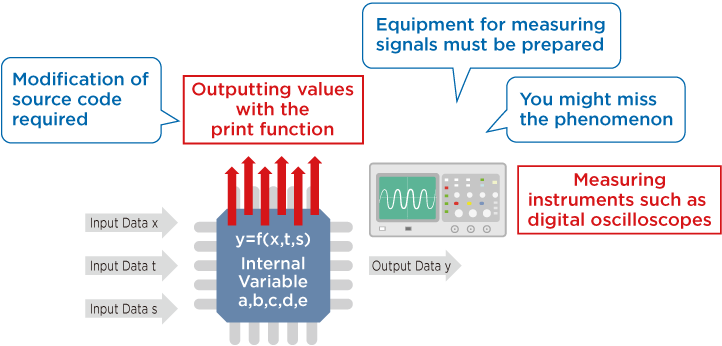
Traditional Debugging Methods & Problems
(A)Memory Data Observation with JTAG Emulator
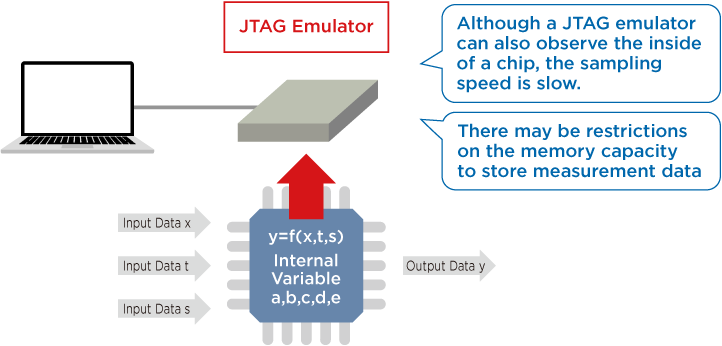
(B)Memory Data Observation with JTAG Emulator
Solution: Data Monitoring via EVRICA
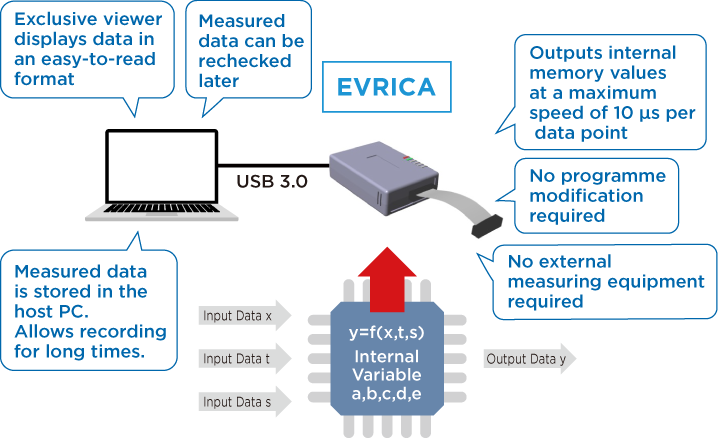
Unlike traditional methods, EVRICA allows you to measure system input values, output values, values of variables and parameters, etc. at speeds of up to 6.5 µs per measurement point, without modifying the source code.
The measured data is stored on the hard disk of the host PC, enabling long-term observation over several hours or days.
Key Features of EVRICA
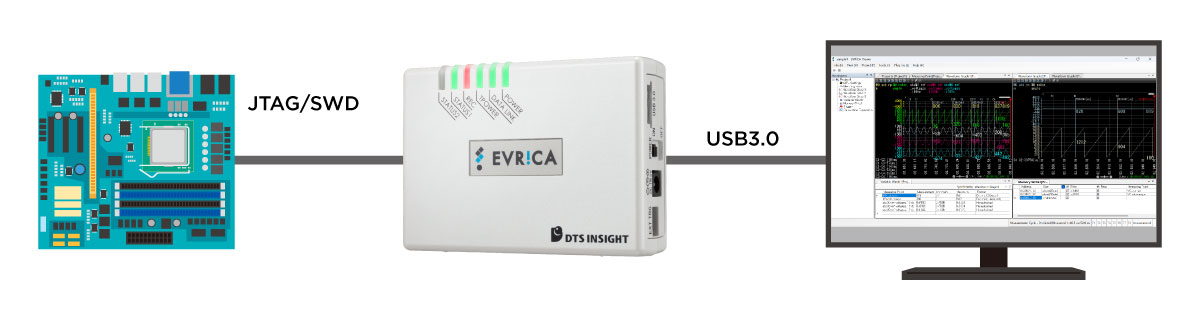
- 1. Data Acquisition via JTAG/SWD
- Compatible with any interface compliant with Arm® Debug I/F.
- 2. No Code Modification Required
- Eliminates the need for monitor programs or software changes.
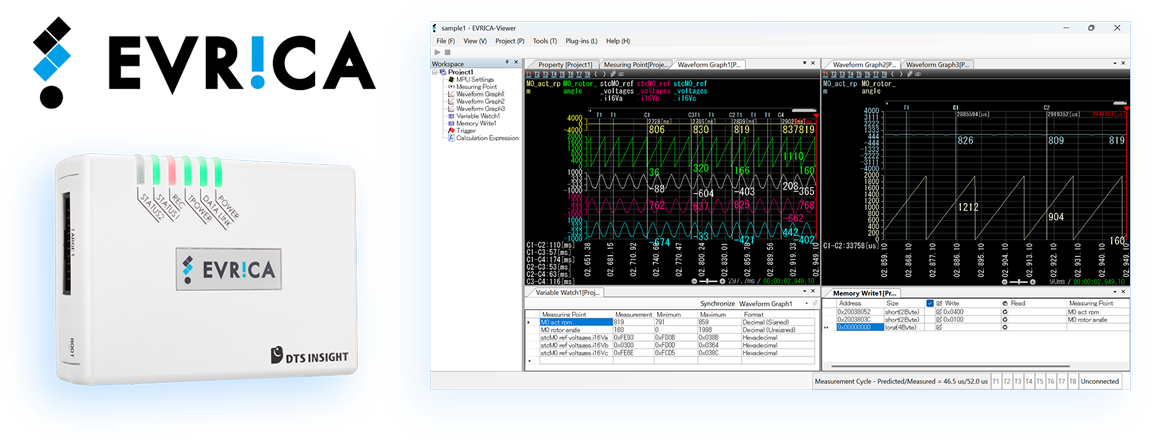
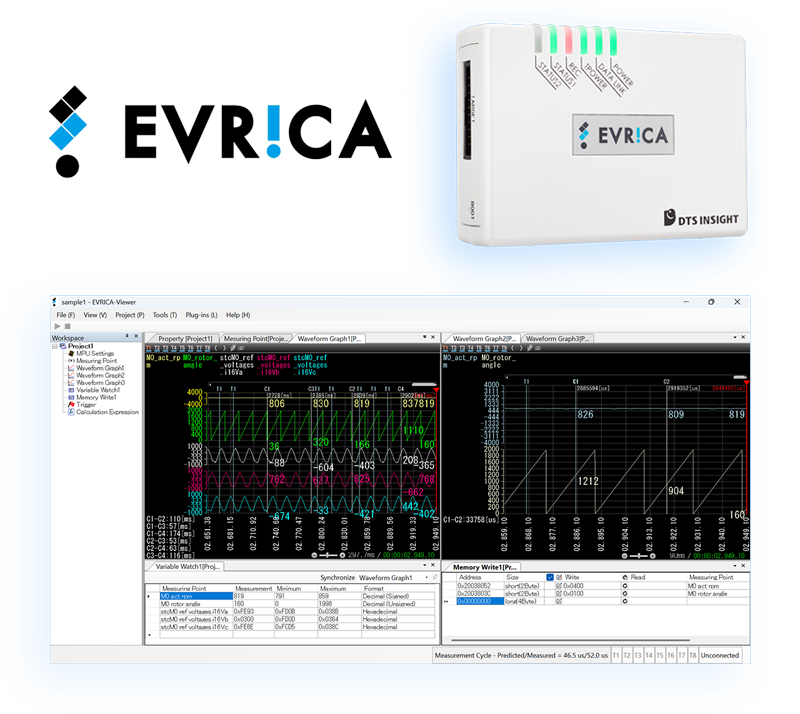
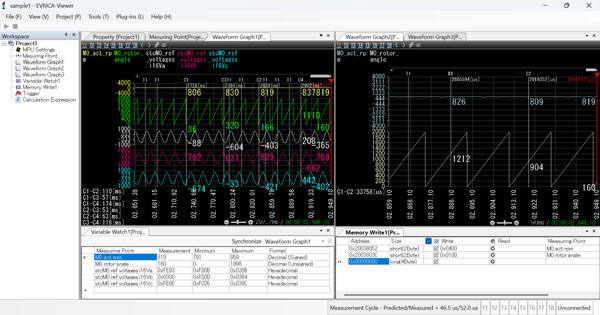
- 3. Optimized UI for Data Flow Verification
- Provides powerful visualization, functioning like a "Software Oscilloscope."
- 4. High-Speed Data Acquisition
- Captures up to 1,024 data points at speeds as fast as 6.5 µs per point.
- 5. Dynamic Data Visualization
- High-speed streaming enables real-time data display on your PC.
- 6. Long-Term Data Logging
- Measurement data can be saved directly to a PC's HDD for later retrieval and analysis.
Key Use Cases
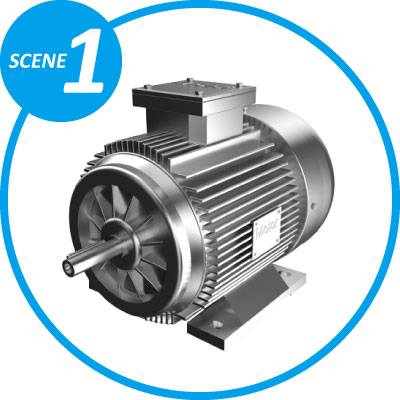
Motor/Actuator Control:Robots, printers, air conditioners, and cameras
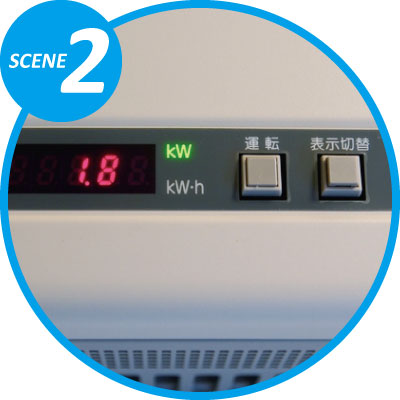
High-Efficiency Power Conversion and Digital Power Control
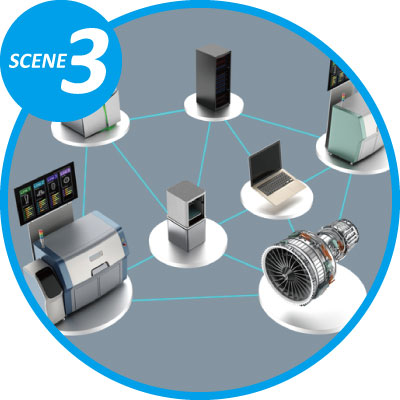
Monitoring and Control of Factory and Plant Environments
Audio Signal Processing in Musical Instruments and Audio Equipment
» For more information, click here
Technical Specifications
| Item | Specification | |
|---|---|---|
| Supported cores | Arm® cores | 32-bit/64-bit microcontrollers with Arm® Cortex®-M/Cortex®-R/Cortex®-A incorporated* * To use a 64-bit microcontroller, the separate 64-bit support option "SKS100" is required. |
| RISC-V® cores | 32-bit/64-bit microcontrollers with RISC-V RV32/RV64 incorporated* * The System Bus Access function must be incorporated. * To use a 32-bit microcontroller, the separate option "SKS200" is required. * To use both 32-bit and 64-bit microcontrollers, the separate option "SKS201" is required. |
|
| Host environment | - | Supported OS:Windows 11 64bit, Windows 10 32bit/64bit CPU/Memory:Conform to OS system requirements |
| RAM monitoring functions | Measurement points | 1,024 points |
| Measurement performance | Sampling method: 6.5 µs/point (4 bytes) at the max speed* * The measurement performance depends on the specifications of the microcontroller. * The measurement cycle can be set to a desired value between 10 µs and 10 s (in 1 µs units). |
|
| Measurement point setting method | • Physical address direct input (Hexadecimal) • Selection of a variable name from a symbol information file |
|
| Designation of measurement data | • 1/2/4/8 bytes designation • Bit field designation (designation of arbitrary bit positions) |
|
| Display of data values | (unsigned/signed) char / short /long /longlong, float/double Display format:Binary / octal / decimal / hexadecimal |
|
| Item | Specification | |
|---|---|---|
| RAM monitoring functions | Chart display | Line graph Four screens displayable, Eight points displayable per screen • Graph zoom in/out, cursor (4 lines) • Cursor difference time measurement • Maximum graph display time: 1h or more • Plot point completion method for graphs: linear or step method selectable |
| Log recording time | Depends on available hard disk drive capacity Overwrites data when the disk limit is exceeded |
|
| Log format | Dedicated file format and CSV format | |
| Loading measurement result files | Graphical display (time axis can be moved via slide bar) | |
| Saving and restoring setting information | Available | |
| Event function | Max. 8 points., Marking on graph waveform, Waveform stop event | |
| Data write | Write data to a specified address | |
| External Trigger | Trigger inputs (2 points) Trigger outputs (2 points) |
|
| Format of symbol files | ELF/DWARF Supported Compiler:Conform to Arm compatible adviceXross |
|