What Can EVRICA Do?
Features and Functions of EVRICA
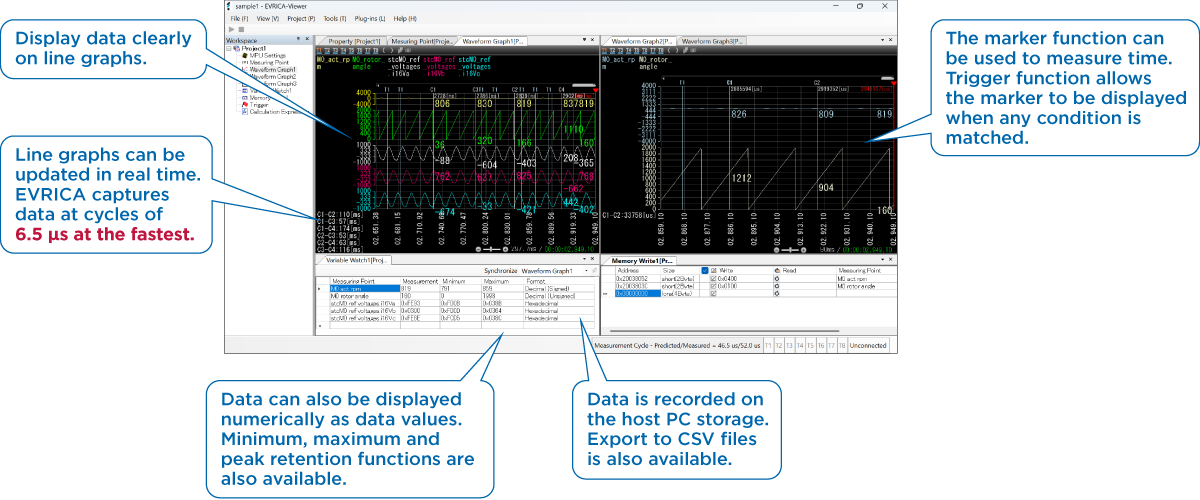
High-Speed Data Monitoring at Speeds Up to 6.5 µs/Point.
No Software Modification Needed! Easy Connection via JTAG/SWD
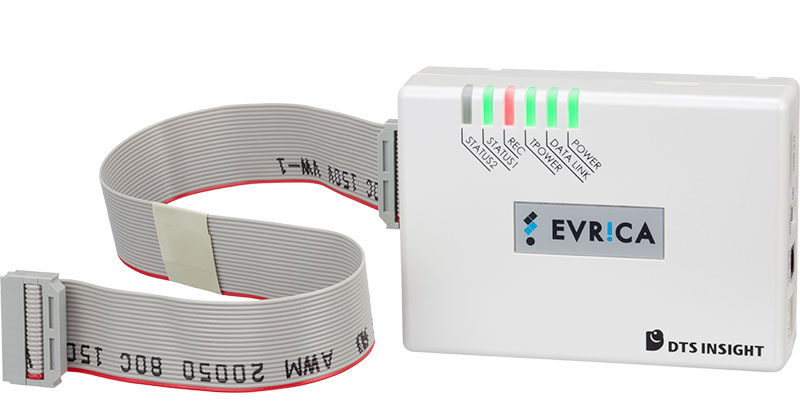
EVRICA main unit
1. High-Speed Memory Readout
The main unit of EVRICA is a compact, palm-sized module. EVRICA reads out Arm® processor memory data from the user system and transfers it to the host PC via a USB 3.0 interface at up to 5.0 Gbps.
By maximizing the potential of Arm® CoreSight, the standard debugging and tracing hardware provided by Arm® processors, EVRICA enables sampling performance of up to 6.5 µs per measurement point.
The memory to be observed can be either on-chip RAM or flash ROM.
EVRICA can also read data from external RAM connected by a standard bus and from memory mapped registers (except for cache memory and TrustZone secure space). Up to 1,024 data points can be read out simultaneously in a single execution.
The JTAG/SWD interface is used for connection to the user system. The length of the connecting flat cable is approximately 35 cm.
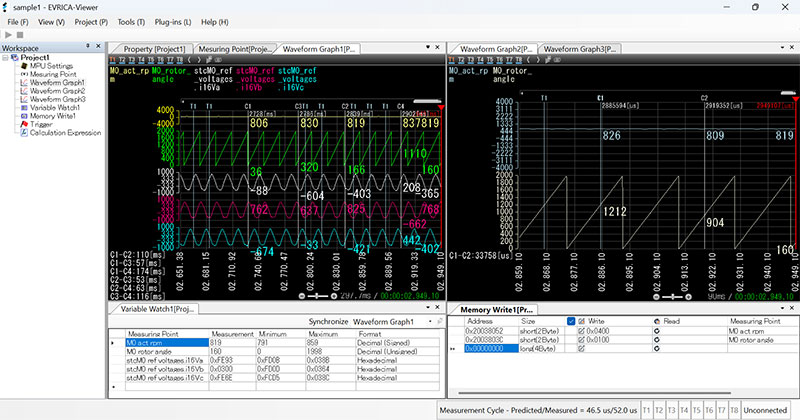
2. Visualization of Memory Data
EVRICA has a dedicated viewer, which allows you to view the memory data retrieved from the user system in the viewer as waveform graphs (line graphs) or numerical values. Waveforms and numerical data are updated in real time. The user pre-sets the physical address of the memory to be measured, the names of variables and the data display format.
For waveforms, up to 8 channels per screen and up to 4 screens (up to 32 channels) can be displayed simultaneously.
Long-Term Data Logging: No Data Loss
Storage capacity required for measurement.
| Channels | Measuring cycle | Required storage capacity | |
|---|---|---|---|
| 1 hour | 24 hours | ||
| 10 | 100µs | 2.2 Gbytes | 54 Gbytes |
| 100 | 1ms | 1.6 Gbytes | 40 Gbytes |
3. Recording and Storing Measurement Logs
Measured memory data is stored on the host PC's hard drive. This allows you to easily review the data anytime using the dedicated viewer, streamlining post-acquisition analysis. Log files can be exported in CSV format. Continuous measurement time depends on available hard disk space.
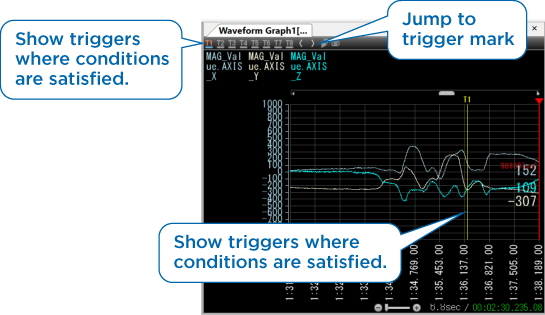
Mark Your Points of Interest (Trigger Function)
4. Stop Trigger and Trigger Output
During the recording of memory data, the system marks on the graph when a pre-defined trigger condition is fulfilled (e.g., variable x=100, y>50, etc.). This makes it easy to locate specific data points after measurement.
The following actions are also available in conjunction with the fulfilment of a trigger condition.
- Stop measurement.
- Only the screen display is temporarily stopped while the measurement continues (snapshot).
- Output trigger signals to link with external devices such as digital oscilloscopes.
Simplified Verification: Modify Parameters and Flags
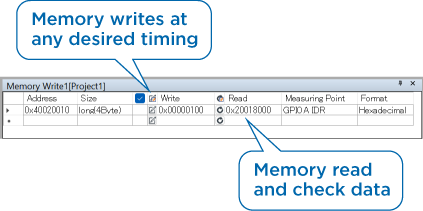
5. Data Write Function (Memory Operations)
A specified 1-4 byte value can be written from EVRICA to a specific address in the memory under measurement at any timing.
By rewriting parameters and flags you can easily change the operating mode and test conditions of your programs. This is useful when verification under various test conditions is required.
Data Calculation & Visualization: Graphs and Watch Displays
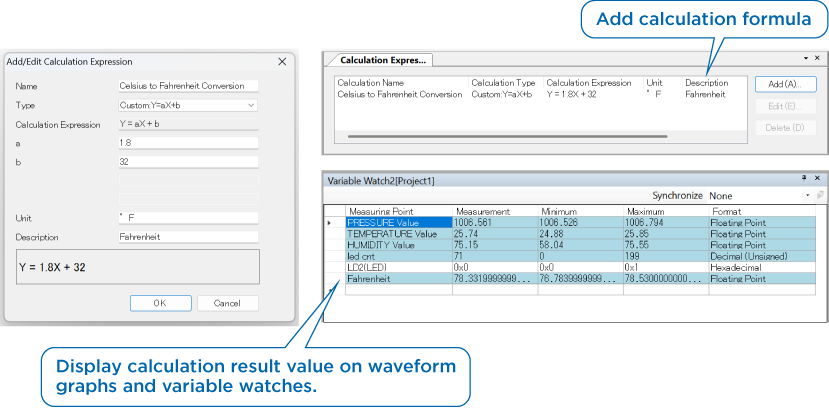
6. Calculation Function (New Feature)
The obtained data can be converted to the values you want to see using optional calculation formulas.
The converted values can be processed in the same way as normally obtained data. For example, they can be displayed in waveform graphs or variable watches, or saved in CSV.
Operating EVRICA in Python: Automate Measurements and Improve Work Efficiency
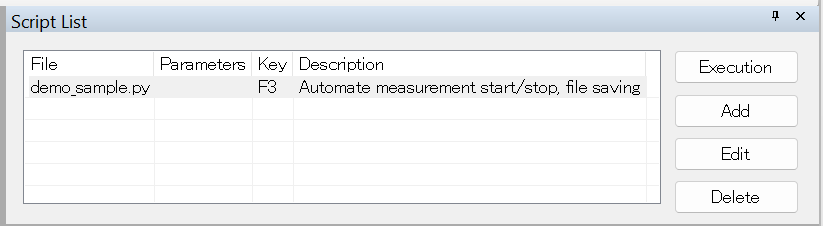
7. Python Scripting Function (New Feature)
Python scripts can perform some EVRICA controls, via a Python plugin.
EVRICA control commands for action-based operations (start, stop, save, etc.) are supported.
Components
EVRICA main unit
• flat cable (20pin, 2.54mm pitch)
• Cable length: approximately 35cm(13.7in)
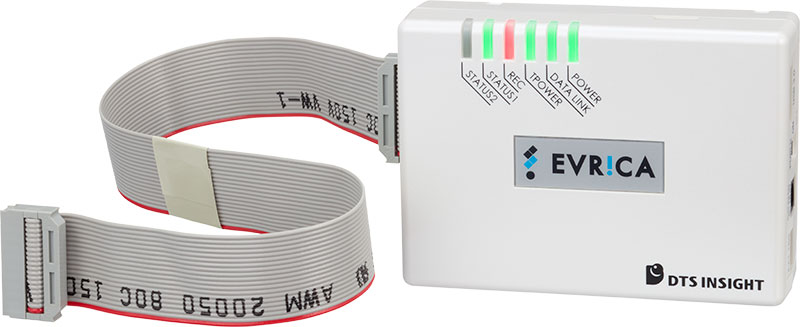
• Powered from the bus (USB 3.0)
Dedicated viewer software