Debug Function
Multicore Supporting
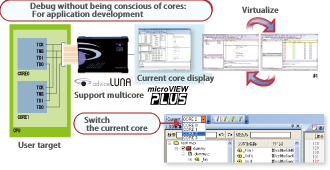
Debug environment with attention to cores (AMP debug)
- A debugger window is started for each core
- Debug operation can be performed separately for each core
- A synchronization function for a selected core is provided
- Reset operation, Go operation, Stop/break
Debug environment as a system (SMP debug)
- Can operate by a single debugger
- Automatic tracking of the core to be debugged on the ICE side
- The application developer does not need to pay attention to cores
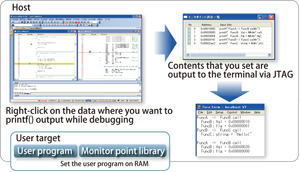
Fuse print-statements and ICE: Monitor Point
By fusing the print-statement debugging and ICE, the operation of program and the variable change can be visualized easily.
You can insert a format (compatible with printf() of C language) equivalent to the print statement from the source code display of the debugger to an arbitrary line to display variable values and messages on the screen via JTAG without executing recompilation.
(This function is optional)
Tcl add on: Create original GUI
"Active Tcl add on" provides commands to access the target resource via microVIEW-PLUS in ActiveTcl.
By using this software, you can create your original GUI to use in various development phases.
Environment: Active Tcl (Version 8.4.19.1)
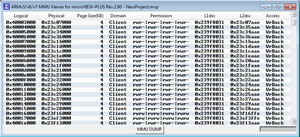
MMU memory control display
using Active Tcl add on
Program display function and other convenient functions
Program display function
Source program of C/C++/ assembler can be displayed.
You can operate various debugging on the Program Display window. Also registration of setting and switch of display are available by the mouse operation.
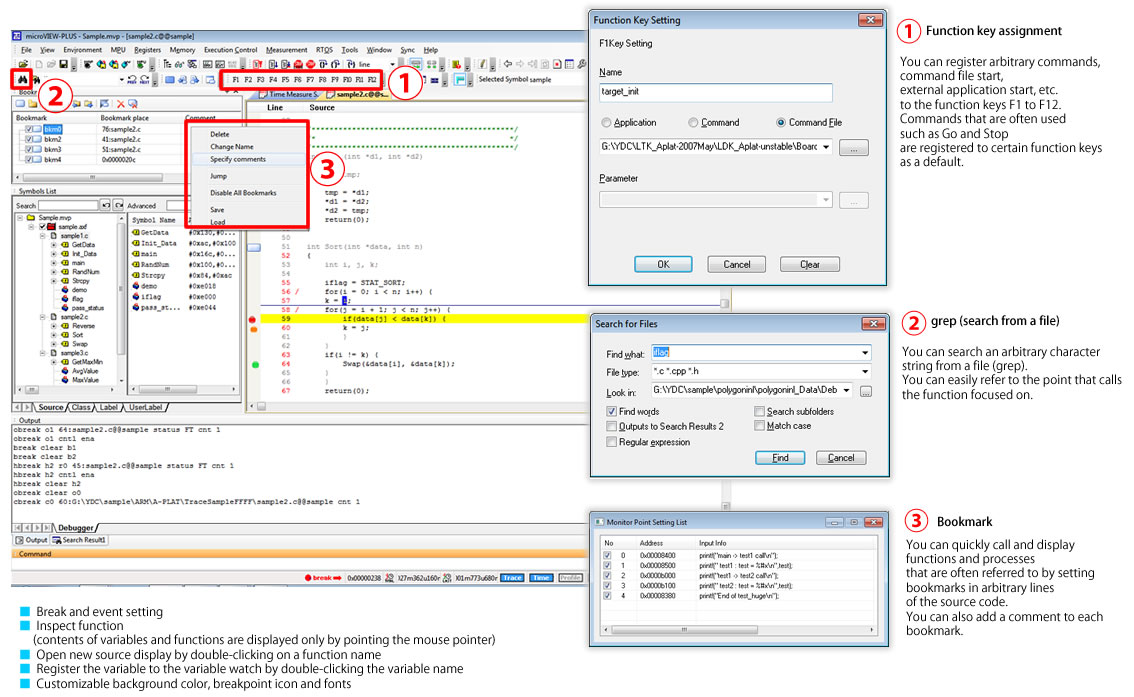
[ Enlarged display ]
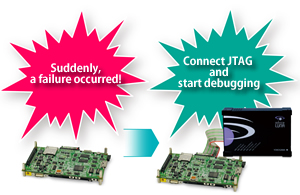
Hot plug function
With use of the hot plug function, you can start the debugger without turning off the power of the target and check various statuses of the target when a trouble occurred.
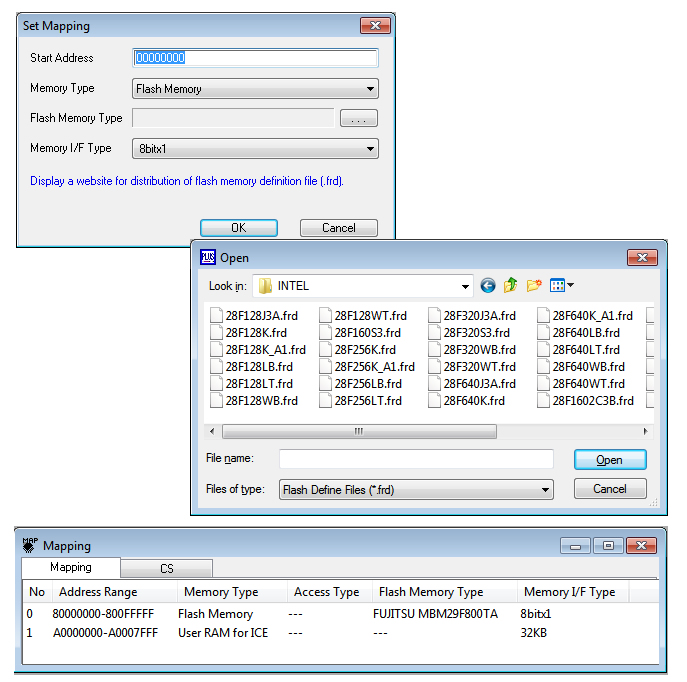
Flash function
You can use this function just by selecting from various flash devices support list.
It supports not only high-speed wiring to the flash memory but also setting of software break.