Measurement Function
Break setting
You can set various breakpoints just by mouse operation.
You can also perform detail settings of each break contents.
- Software break max. 1024 points/Hardware break max. 16 points
- Software break by conditional expression/specified number of times
- OCD break with MPU internal resources
- Countable break for which specified number of times can be set
- Temporary break with which up to the target line is executed
Memory operation
You can perform operation for efficient memory operation. Bisection display is available for each tab.
You can check the change of values easily by setting whether data shall be updated or not at the time of break for each window.
- Damp, editing, copying, comparison, search, fill function
- Address setting function with drag and drop operation
- Display and operation in multiple windows
- Display the current stack updated automatically by specifying the SP register
- Periodical update data watch function
Break history function
The status of the user system can be automatically retained when a break occurs and the history at the time of the break can be displayed.
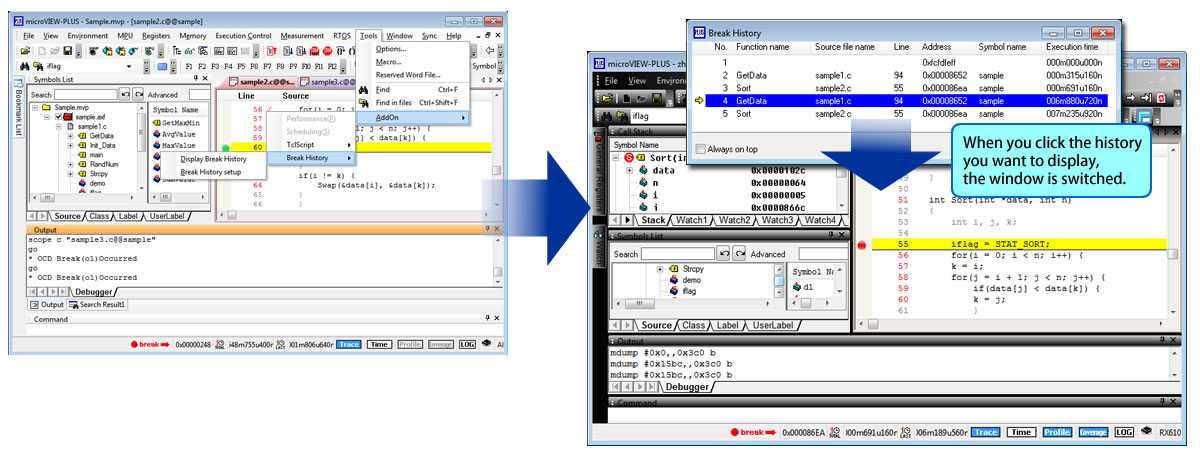
[ Enlarged display ]
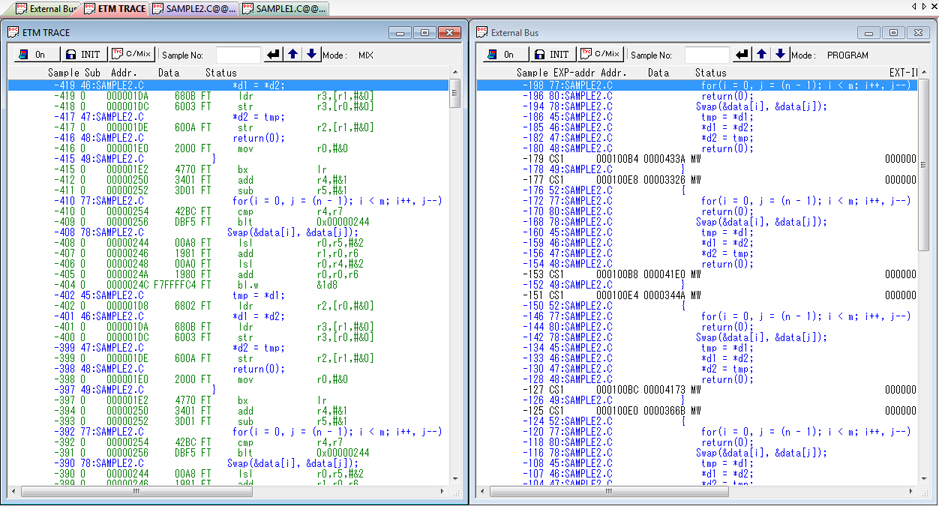
Trace function
OCD trace with the MPU internal resources can support branch PC trace.
Withan external bus trace, detailed trace of bus information can be executed.
The trace data can be narrowed down based on the detailed conditions set in user event and the limited trace buffer size can be used effectively.
A function chart can be also displayed with use of the trace data sampled.
- Three display modes of program, disassembler and MIX are supported
- Normal trace and multi sample trace function for which conditions can be set
- Trace data search function
- Synchronized display of OCD trace and external bus trace
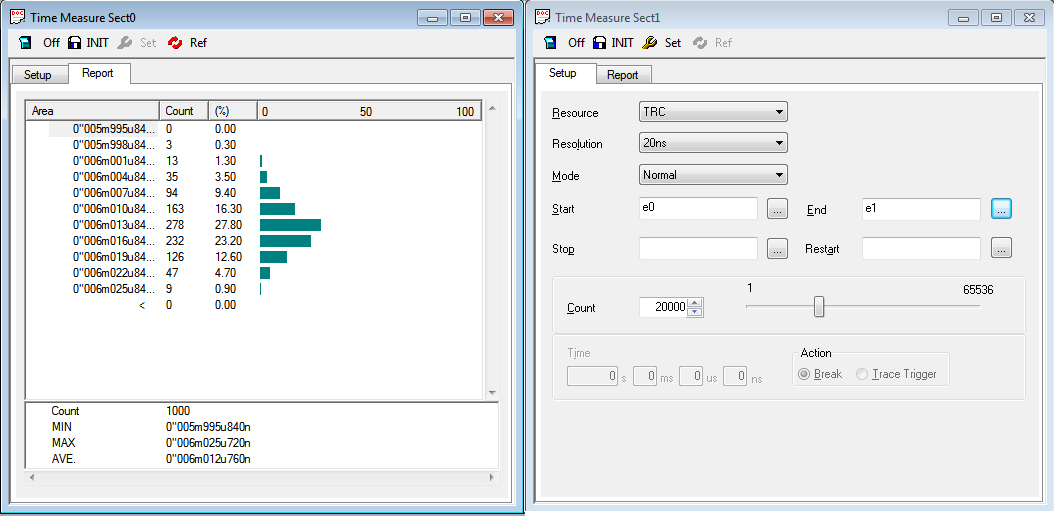
Performance function
You can perform time measurement of sections specified in user event.
The measurement result can be displayed in a graph for easy understanding, which includes the execution rate of each time interval in addition to minimum/maximum time and average time display.
You can make a break occur automatically and check the trace after that when the set time is exceeded. It is also effective for debug in troubleshooting.
- Measurement range and excluded range can be set in user event
- Besides the time measurement, time-under and time-over can be detected by specifying the time
- Histogram display that allows you to check time distribution easily
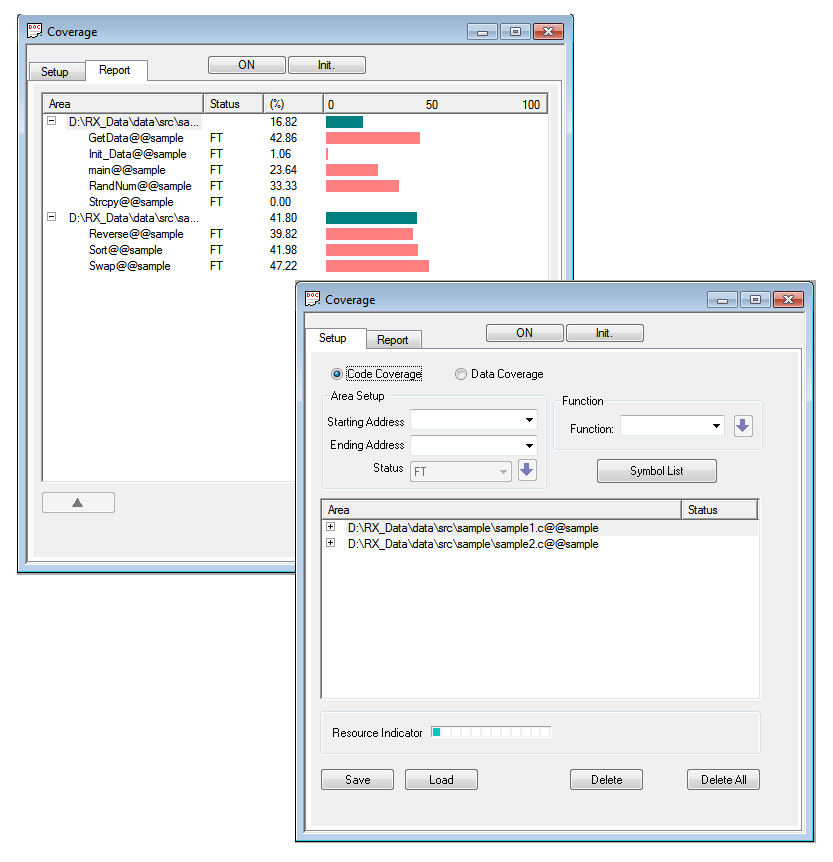
Coverage measurement
The execution coverage rate of the program can be measured by the C0 coverage function.
You can utilize it as an integrated evaluation when development is carried out for each part, by searching and finding points that have not been executed.
- Code coverage or data coverage can be measured
- Area setting (status setting as well) and function specification by address are possible
- Histogram display that allows you to check the execution coverage rate easily
- Reflect execution points to program display
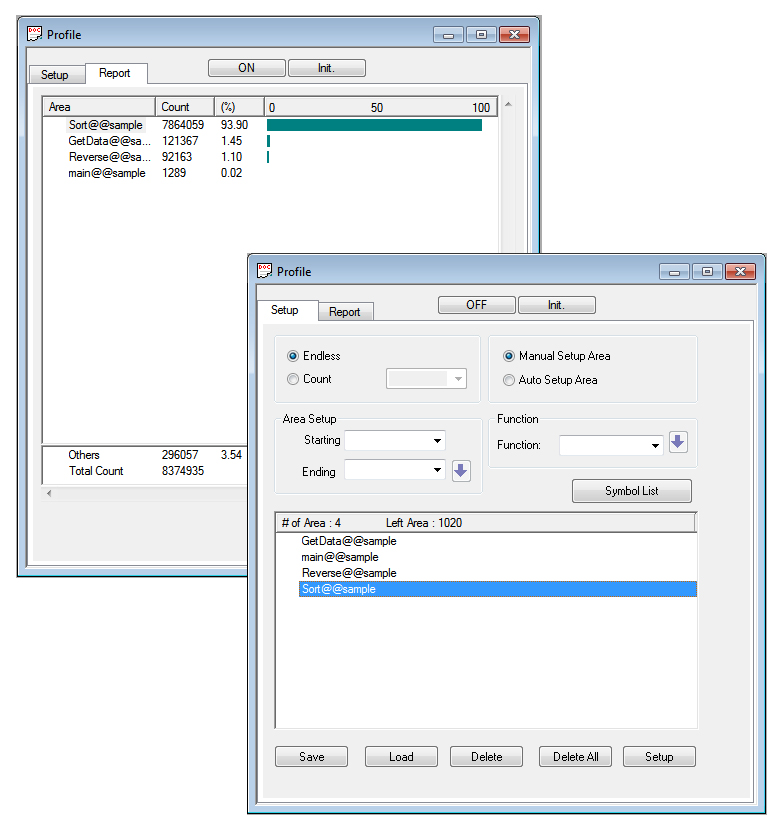
Profile measurement
The execution load of a program can be measured. You can judge which area has a heavy load from time frequency. It serves as an index of performance improvement of the entire system.
- Up to 1024 areas can be measured
- Selectable between measurement for specified number of times or measurement for limitless number of times
- Areas and functions can be specified by addresses
- Histogram display that allows you to check time frequency easily